| |
PROFIT Data, US, 1990-2010
that affect US Industry
| US PROFIT Data from 1990 - 2010
Sources: US Department of Commerce, group: BEA (US Bureau of Analysis) for Income, Expense and
Profit, DocStoc.com for Unemployment. For references, see
HERE. FORWARD, and ANALYSIS This raw
information comes from the US records, US Department of Commerce, BEA as shown above.
Note that the US Department of Commerce gives figures that include all
of federal, state and local, and not just federal. This is
my third update on this page. What this shows me is that while it
is quite hard to find the raw US official data, it is far harder to
analyze it. I have determined that it is harder to analyze since
there are many factors. Some periods have "peace in our time" and
have an edge. Other periods may have wars, or perhaps even worse,
recessions. Some of these issues are external to governments.
But even if not, is who controls Congress more important? Or who
controls the Presidency? And if there are issues like recessions,
then what did that group do to solve those issues and were they
effective? So it can get complex. And yes one must work to
be fair. But here are a few things I believe I see in the below
graphs:
- 1994-2000 With a Split Washington DC with Democrat Bill Clinton
in office and a Republican Congress, they apparently worked well
together and we had 6 of our best US years with low unemployment and
profit rising to get the US to at least not add more debt.
Some people have given me their opinion that a split government is
best, since checks and balances are then in place as our founders
intended.
- The Republican versus Democratic thing? The last ten years
have been bad financial years for Americans. Bush lost us
about $5 trillion in added debt and Obama just over $3 trillion his
first two years.
Of course Bush had four times as much time to lose money so that
means Obama is losing it more than twice as fast. And one
could say that at least Bush was honest since during a book signing
he said he knew nothing about finance. Okay, got it. But
that was supposed to be what a cabinet is for - to advise. But
regardless of whose reasons we like the most, both lost money and
drove the US into financial problems.
- 1994-2006 These years are mostly okay and do coincide with the
Republican Congress being in office. This makes me wonder if
it is more important who is in charge of Congress rather than the
President.
- Recessions - the most obvious ones are two in 2001: the
dot.com recession and 911, and the housing/mortgage recession in
2008. These did influence the period above this comment and
also the Bush years below it
- 2000-2008 - The Bush Years. I am not going to claim that
Bush was a financial genius, but what I see is that he received more
criticism than he should. He had two recessions at the start
of his office in 2001, the dot.com recession and the 911 recession
which affected travel. I do not see how one could blame him
for either of those fairly. I do believe George Bush was often
slow to take action, as during these recessions and also Katrina,
but some of his techniques to me at least seem reasonable. The
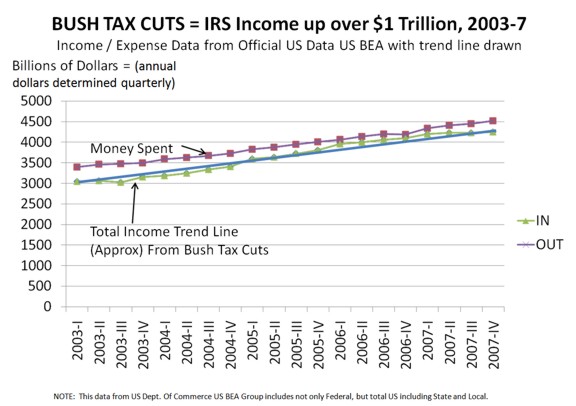
Bush Tax cuts for the middle class and also "the rich" as some like
to complain about, did work well between 2003 and 2007 even though
some of his critics today claim the opposite. While some say giving
tax breaks to the rich costs the US money, that is not in evidence
as you can see from the Income/Expense graph that IRS income
actually rose in that period well, and of course also the profit
graph rose well which is really income-expense, as you might judge
any business.
- WAR COSTS - Some people do claim that the Bush era was mainly
huge losses due to war. If you look at the graph, that is not
in evidence. Certainly there was a war cost but the Bush years
in my opinion were mostly dominated by three recessions and then
recession recovery. Certainly the war costs added to push this
graph downwards, but how much is hard to see. One would need more
information. However, I will make the statement that if
someone claims the Bush years are due solely to war costs, that that
is just wrong. The graphs shows mostly recessions and
recovery.
- BAILOUTS - This is for each taxpayer to decide. But what I
have learned recently is that while both TARP and STIMULUS are both
bailouts, they have huge differences. While many US taxpayers
are against bailouts of any kind, some economists do try to tell us
that if you have a run on the banks, some temporary money to stop a
landslide and then banks going out of business is a good idea.
That is TARP. TARP done by Bush was for the emergency of the
run on banks and also was a loan. As of this time, I
understand that all of TARP has been repaid but about $150 billion,
so that is not causing the major amount of our increasing US debt.
However, STIMULUS as done by Obama was not done for an emergency on
a run on banks and was not a loan but money given away forever.
Its purpose was for those who believe in the Keynesian philosophy
that during a recession throw money at the problem to stimulate the
economy. But the money left the US taxpayers and the
unemployment remains at 10% or so. I am certain that whoever
wanted stimulus had good intentions. But as a taxpayer I think
it looks to me that unlike TARP, it did not work and was not a good
idea.
View the below data, or
skip ahead to another page for: profit -1969-1990
or profit 1947-1969 or
profit 1929-2010 |
|
|
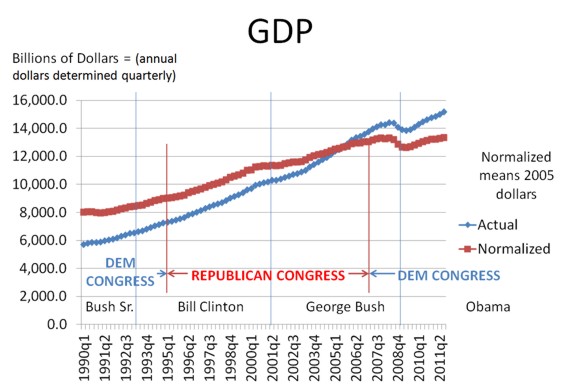
This GDP chart seems mostly to go up except for the 2008-9
US Housing Mortgage-caused recession.
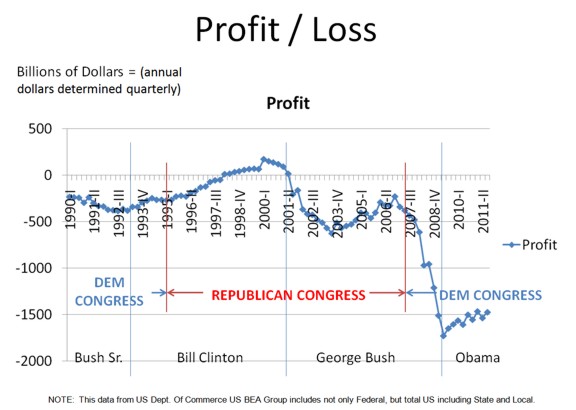
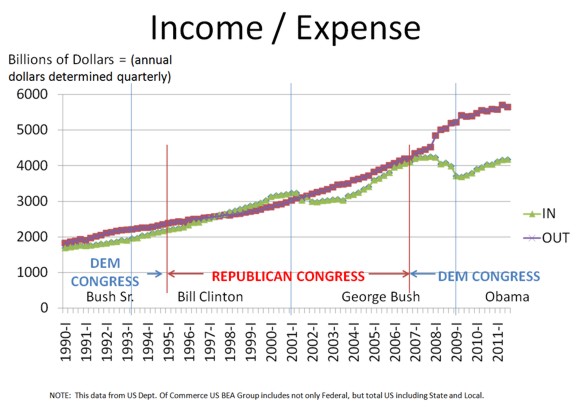
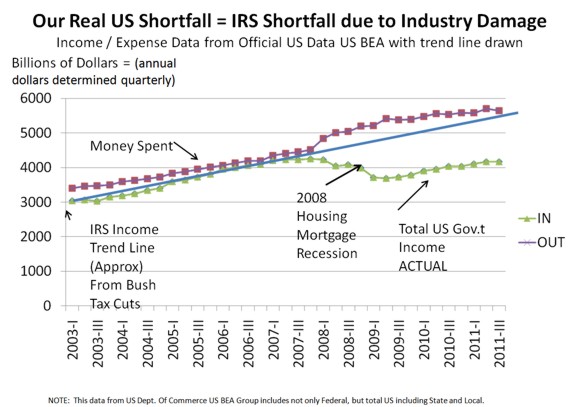
Note first of all that of course income and expense are very much related to
the profit curve ahead. Aside from some US financial correction items,
the profit above is basically income minus expense. And of course
income for the US government is mostly IRS income.
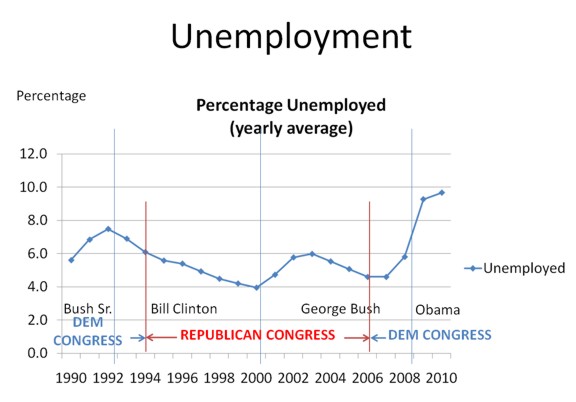
This graph behavior in my mind is not so hard to understand since to me it
somewhat follows the profit curve. Hurt by three recessions, and some
improvement in between.
|
|
